
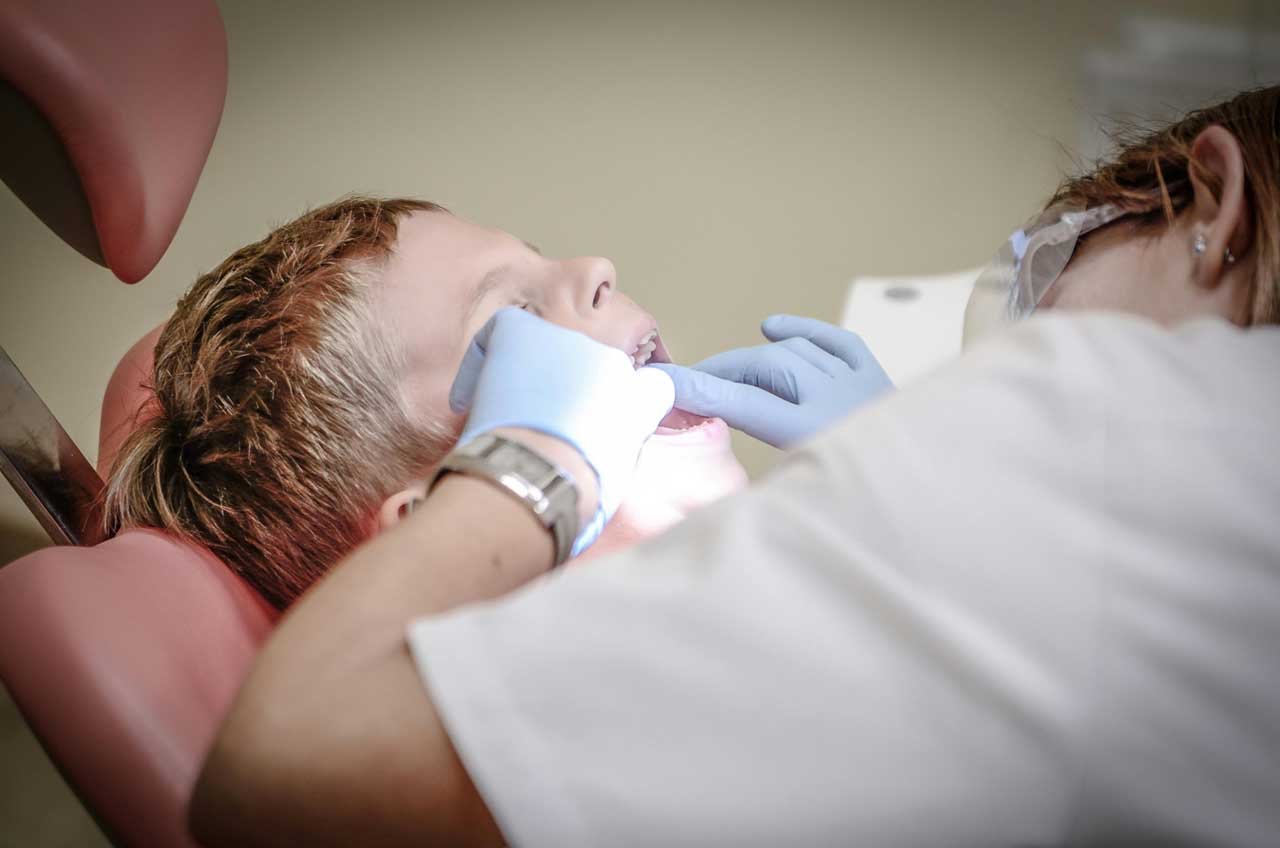
Oregonians Spend Over 4% of Their Income on Dental Care, Well Above the National Average
Recently concluded nationwide research indicates that Oregon residents pay 4.03% of their outgoings on dental work, 26% above the national average. As a state, Oregon ranks 10th in the nation.
Oregon Residents’ Dental Care As A Share Of Outgoings
Toronto dentist Thorncrest Dental analyzed the 2023 Bureau of Economic Analysis on the average annual per capita expenditures across the US, comparing total spending to dental care spending.
The top 10 states where residents allocate the highest proportion of their income to dental health are:
| Ranking | State | Percentage of personal spending spent on dental work | Average expenditure on dental services | Average personal spending by state |
|---|---|---|---|---|
| 1 | Idaho | 5.30% | $566.79 | $10,691.65 |
| 2 | Utah | 5.27% | $563.33 | $10,683.54 |
| 3 | South Dakota | 4.73% | $662.83 | $14,000.47 |
| 4 | Washington | 4.70% | $705.92 | $15,012.98 |
| 5 | Nevada | 4.53% | $541.03 | $11,951.55 |
| 6 | Montana | 4.27% | $605.07 | $14,181.88 |
| 7 | Colorado | 4.25% | $640.94 | $15,068.89 |
| 8 | North Dakota | 4.09% | $607.73 | $14,856.86 |
| 9 | Arizona | 4.08% | $519.51 | $12,721.83 |
| 10 | Oregon | 4.03% | $630.54 | $15,652.55 |
From total personal spending of $15,652, Oregon residents spend 4.03%, or $630 annually, on dental care. In contrast, Idaho residents (ranked #1) spent 5.3% of their outgoings, or $566.79, while Ohio citizens (ranked #50) spent just 2.29%, or $420.09.
In New Hampshire, residents spent 3.8% of their outgoings (ranked #13), but this still translated to the highest per capita costs at $743.43.
While Oregon ranked at #10 in the percentage of outgoings, the average annual expense of $630.54 is the 7th highest on the research table.
Kentucky, which ranked #44 as a percentage of outgoings at $387.13, had the lowest dollar amount, whereas Ohioans (Ranked #50) spent $420.09 per capita on average.
The research confirms what almost half of US adults said in a July 2025 KFF poll —that it’s difficult to afford healthcare costs.
The US average annual percentage of annual spending on dental care, based on an average yearly per capita spending of $16,244 and dental costs of $524, is 3.2% of total expenditures.
Dr. Max Dawabsheh of Thorncrest Dental confirmed that while the Northwestern and rural states show the highest proportion of outgoings on dental care, rural states such as Idaho, North Dakota, South Dakota, and Montana may have lower living costs, which inflate the relative costs for maintaining good oral health compared to other parts of the country.