
Oregon Job Numbers Reveal Unemployment Was Climbing All Along After Shutdown Left Economists Blind

The federal government shutdown left economists flying blind about unemployment in Oregon, but newly released figures from the Oregon Department of Employment show the picture was worsening all along.
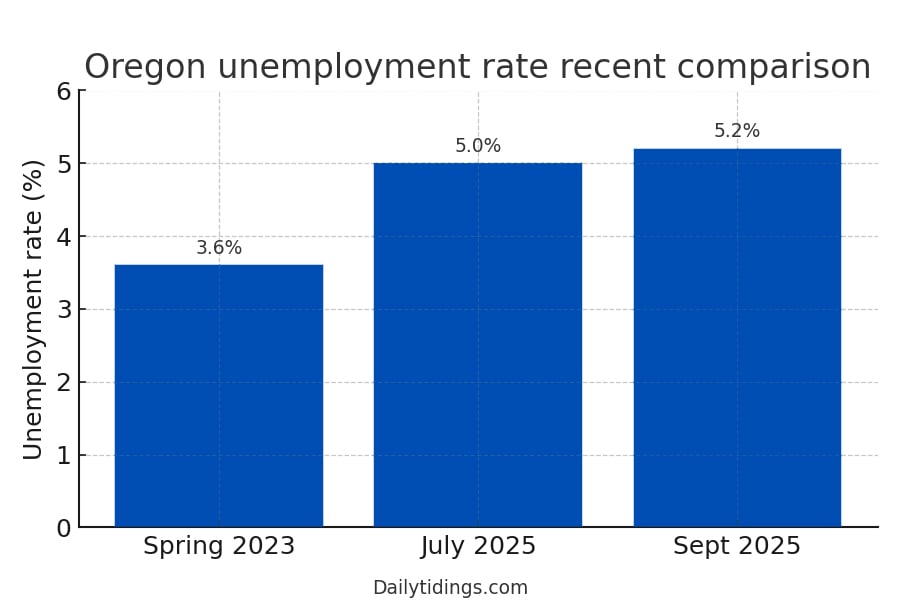
Preliminary August data pegged unemployment at 5% with 6,900 jobs added, but unemployment insurance claims averaged 33,600 a week in 2025 – 20% higher than last year, suggesting deeper weakness.
Meanwhile, private employers still report 50,000–54,000 job vacancies, underscoring a persistently softening labor market.
Source: Oregon Employment Department / Summer 2025 Job Vacancy Survey
Dailytidings.com
The Beaver State’s Employment Rate is Significantly Higher Than the National Average
The picture darkened yesterday when the Oregon Department of Employment released figures revealing that 5.2% of the Beaver State’s workforce was unemployed in September.
Sources: Oregon Employment Department / Employment in Oregon press release and Job Vacancy Survey / U.S. Bureau of Labor Statistics September 2025 Employment Situation
Dailytidings.com
This is a significant decline compared to Oregon’s 3.6% unemployment rate during the spring of 2023. Additionally, it is worth noting that Oregon’s September unemployment rate was 0.8% higher than the national average.
The state’s seasonally adjusted non-farm payroll employment rose by 3,300 jobs, following a revised gain of 3,500 jobs in August.
Healthcare and Social Assistance Industry Continues to Grow
Once again, the healthcare and social assistance sector sustained its growth, adding 1,300 jobs in September. Construction and professional and business services also expanded their workforces, each increasing payrolls by 700 employees.
However, employment in the construction industry was slightly down compared to the two prior summers. In September, 116,100 posts were filled, a 1.4% drop compared to September 2024.
| Sector | Sept 2024 jobs | Sept 2025 jobs | Change | Percent change |
|---|---|---|---|---|
| Total nonfarm payrolls | 2,010,100 | 2,015,600 | +5,500 | +0.3% |
| Health care / social assistance | 308,800 | 320,200 | +11,400 | +3.7% |
| Construction | 117,700 | 116,100 | -1,600 | -1.4% |
| Manufacturing | 187,200 | 177,600 | -9,600 | -5.1% |
| Professional / business services | 268,900 | 253,700 | -15,200 | -5.7% |
While professional and business services added 700 jobs in September, this sector of the economy has been shedding jobs since early 2023, when it peaked at 268,900 jobs in March. It has since shed 15,200 positions, or 5.7%.
Manufacturing too shed 200 jobs in September, a decrease of 9,600 positions, or 5.1%, since September 2024.
The Oregon Employment Department will release the September county and metropolitan area unemployment rates on Tuesday, December 16, and the statewide unemployment rate and employment survey data for October and November on Wednesday, January 7, 2026.